
Visualized NWSL data
I am a visualizationary.

One way I’m powerfully nerdy is that I like playing around with data in excel and seeing things that I truly believe only I find interesting. Usually I just keep in on my computer, never to show anyone. Sometimes I show my wife, if only to get the “aw…good job sweetie” head pat.1
And once in a great while, I make basic visualizations!
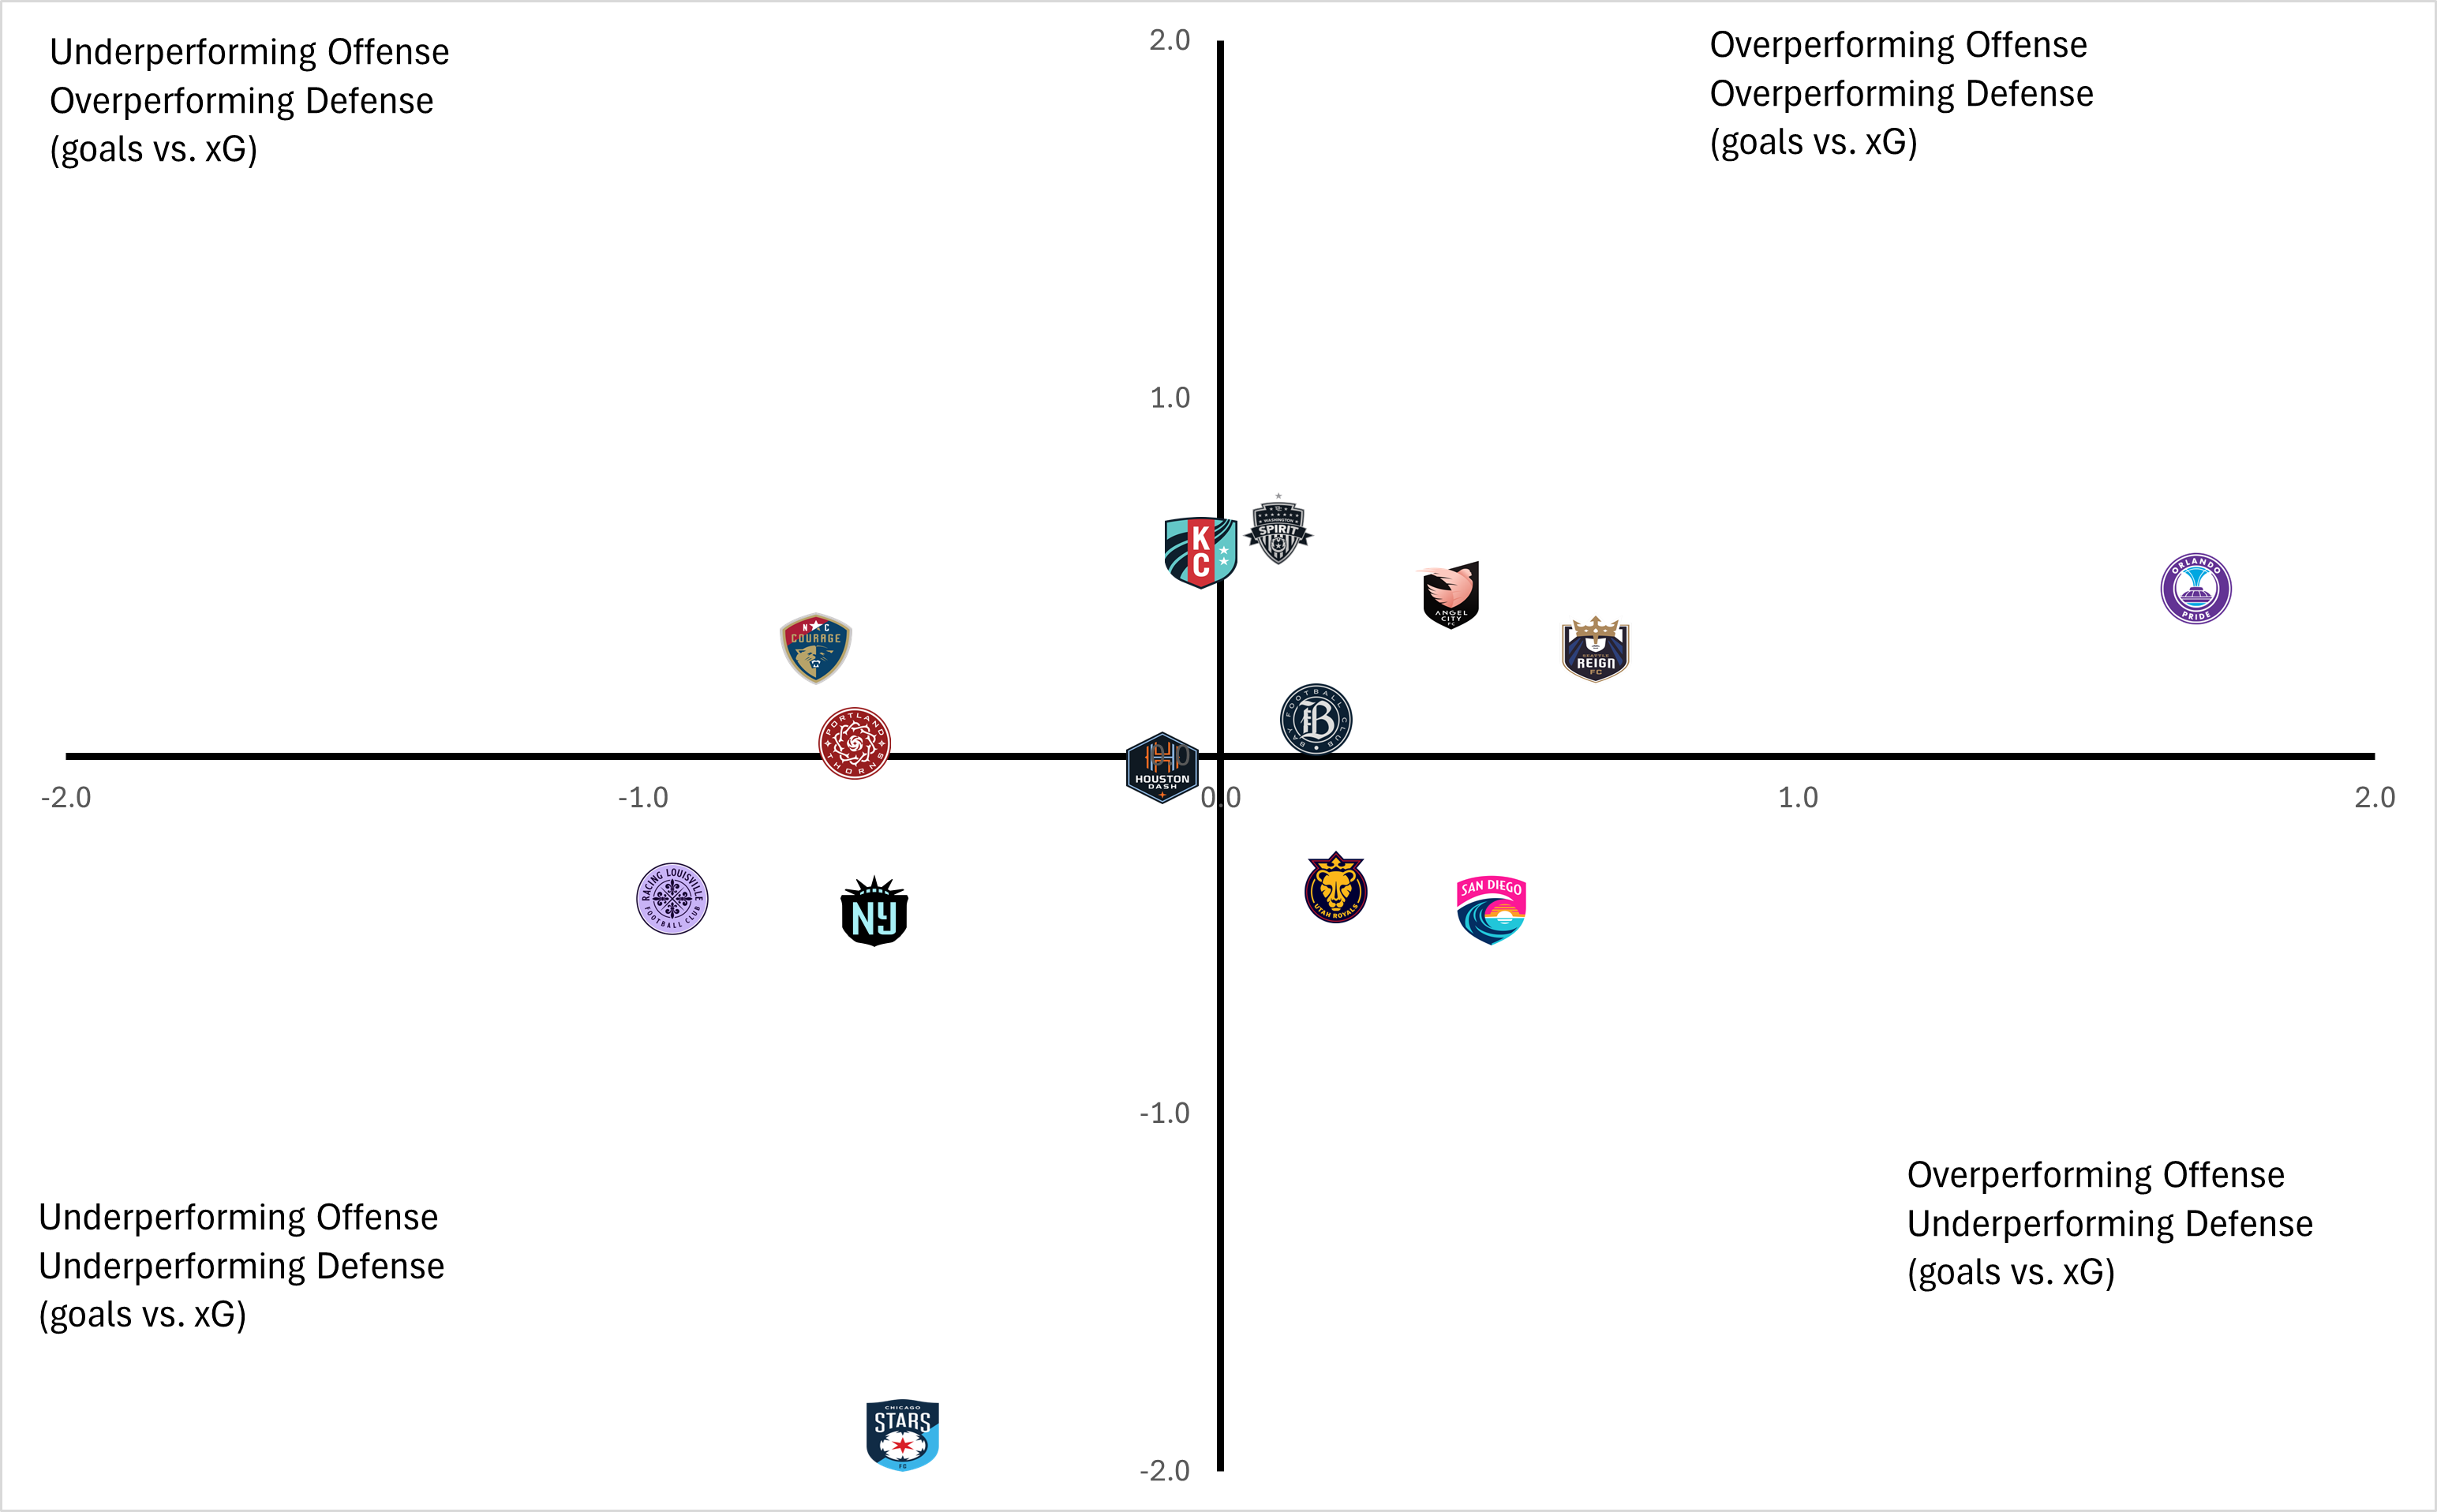
Like this chart right here, showing which teams have the most luck on defense or offense, showing the relationship between actual goals scored/allowed vs. xG.
I want to take a time out and describe what I mean by luck, because I’ve talked to people about luck in an athletic sense, and it’s sometimes tough to explain to other people that ball do in fact lie. Luck, in the cosmic sense, is just shorthand for “how a teams results are matched with their expected results by this one metric.” Or how efficient their production is in relation to results. Whatever, define how you need.
This info also doesn’t really allow anyone to draw conclusions. It’s more like a “hey, we can expect these teams to course correct one way or another.”2
But that’s no fun. This is what the data is telling me:
Houston and Bay are what we think they are.
Orlando dropping 6 on Chicago has inflated both team’s results positively and negatively.
I never would have expected San Diego’s defense underperform while their offense overperforms at this point in the season, based on their roster. Or any point in the season, if we’re being honest.
Ever so slightly…Kansas City’s offense is underperforming. This is likely due to two offsides goals called back that Chawinga scored.
The metrics are saying Gotham and Louisville are dull as shit.
There may be some hope for NCC yet.
This stuff doesn’t account for injury. So yes, Spirit are very, very dangerous.
Stay tuned for more insights like “Kansas City is good”.
Though I don’t want people to touch me, I feel like I should be getting more verbal head pats, if we’re being honest.
Regression to the mean and all, but there are also cases of teams say…overperforming their metrics and they still get the positive result while the metric keeps up. After three games, what I’m saying is, we don’t know if anything in this chart is significant.